

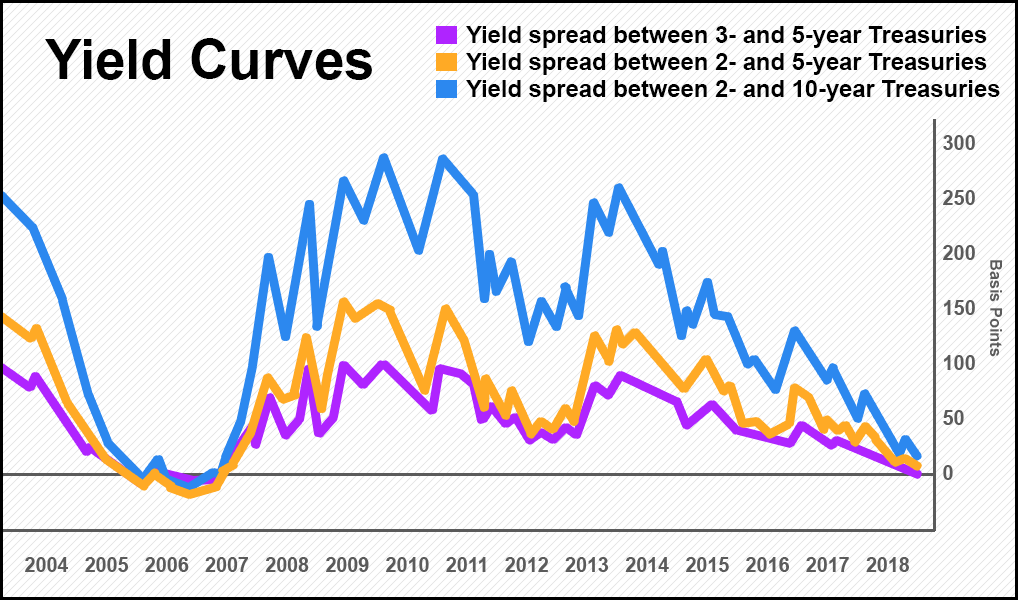
U.S. indices took a bearish stance on Wednesday as the front end of the U.S. Treasuries yield curve experienced its first inversion in over a decade. Not since 2007 has the 2- to 5-year and 3- to 5-year gap fallen into negative territory.
The news was enough to shave off some of the gains made earlier this week over concerns that an economic contraction was imminent – coupled with uncertainty about Trump’s negotiations with China. But not all traders believe the inversion is a guarantee that a full-blown recession is on the way. In fact, this may just put more pressure on the Federal Reserve to maintain their dovish stance for the long-term, at the risk of causing extreme pain to both the U.S. and global markets.
What Does It Mean When a Yield Curve Becomes Inverted?
After the markets closed on Tuesday, the yields on shorter-maturities, namely the 2-, 5-year and the 3-, 5-year yields, stumbled below 0 for the first time in 10 years. The 3-year is now returning 2.84 APY, while the 5-year is returning 2.83 APY. In other words, short-term debt has now become riskier than long-term debt—a rare event that has often portended a full-on recession, as it did in 2007.
Because of the unusual nature of an inverted yield curve, economists see it as a bearish sign that the economy could go south.

According to our in-house analysts, the short-term underperformance may be due the de-escalation in the trade war by China and the U.S., as traders seek out riskier assets. The inversion could also be due to a possible increase in rates next year due to the positive talks between Trump and Xi.
As Bloomberg notes, “either way, the five-year is faring better because investors anticipate the end of the central bank’s hiking path beyond next year.”
Gennadiy Goldberg, a TD Securities rates strategist, also said that, “the outright inversion could be reflective of the market pricing in some cuts starting in 2020, which may be helping the 5-year tenor outperform slightly.”
More Advisors Weigh in On Inversion in Yield Curve
John Iborg of QS Investors LLC isn’t buying the fear of inversion just yet:
“I don’t think that that the 3s5s inversion alone will impact performance across asset class in the near term,” he said. “More flattening or an inversion in 2s10s and 10s30s will grab people’s attention more and will matter more to market participants and expected returns.”
Meanwhile, Ian Lyngen, a Senior Interest Rate Strategist at CRT Capital Group, noted that while the longer-term yields aren’t negative yet, there’s a good chance they could be by 2019:
“The combination of a committed FOMC and mounting global economic headwinds puts the curve below zero as 2019 gets underway,” he said. “If not then, the March FOMC meeting becomes the most opportune inflection point.”
This Is Only a “Small” Inverted Yield Curve
When shorter term yields approach parity or rise above longer-term yields, the yields with the shortest maturities are the first to cross. While inversions to the 2-year and 5-year treasuries are important indicators to consider when assessing economic risk, it’s the inversions against the 10-year and 30-years that are considered the most serious, and the gap between the two is slimming more with each passing day.
Right now, the spread between 2- and 10-year rates is just below 15 basis points. That’s the flattest its been since 2007. And if the trend continues, this key indicator could be under 0 by early next year.
The question then becomes:
“What is the market saying when it considers a 3-year treasury yield riskier than a 5-year?”
Markets are sometimes wrong, but if they’re right in this case it’s a very bearish sign that could exacerbate fears stoked by continued trade strife.


