We’re almost halfway through January, and the market continues to rise. Economists say we’re at the end of a cycle – one that should be finishing up relatively soon. America’s top CFOs (chief financial officers) predict a slowdown at the end of the year.
So, why aren’t stocks dropping?
Aren’t investors due for a “cooling off” period after so many weeks of consistent gains?
Apparently not. The S&P 500 and Nasdaq Composite hit another pair of all-time highs today. The Dow reached 29,000 on Friday.
And some stocks – particularly those in the homebuilder sector – look ready to leap off the charts in Q1 and Q2, even though nearly everyone has low expectations for the second half of 2020.
It’s all thanks to a survey from the National Association of Home Builders (NAHB), released late last year. NAHB members, supported by recent housing data, now believe a U.S. housing shortage is going to hit at some point this year.
That’s bad news for first time home buyers, and all homeowners should a true crisis arise.
But it’s great for homebuilders poised to “solve” America’s housing problem, especially if consumers remain strong and unemployment stays low.
Last week, homebuilder stocks erupted. As of this morning, they’re (mostly) beginning to fade. One company, however, continues to rise and is now staging a breakout that could reach above its 2019 high.

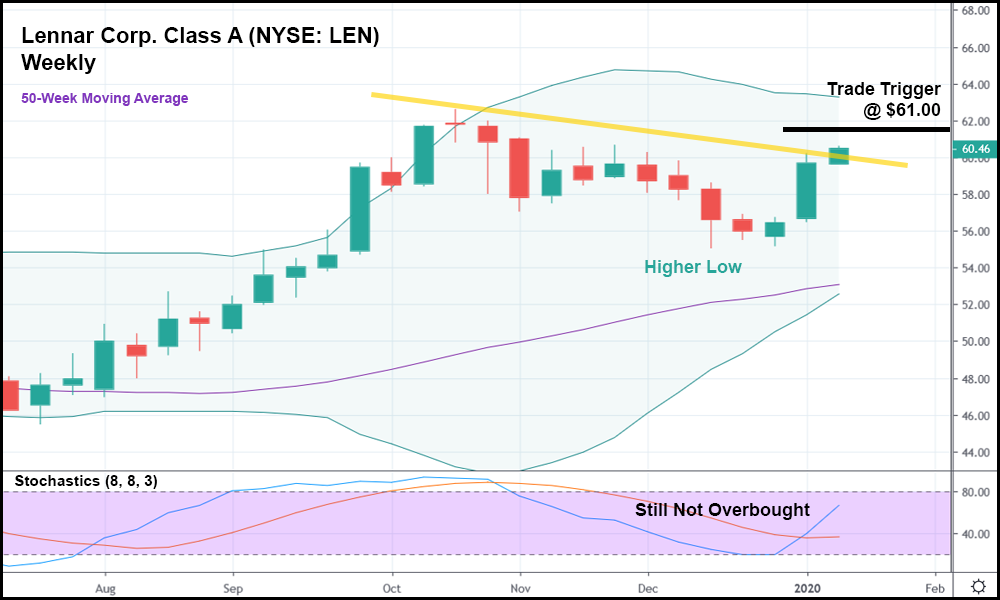
In the weekly candlestick chart above, you can see that Lennar Corp. (NYSE: LEN) fell significantly from early November until the end of December – a period in which the general market soared. It was a disappointing end to 2019 for LEN shareholders, as the rest of the year had been highly profitable (as reflected in a 42% yearly gain).
And though LEN spent the last few months falling, it’s now starting to stage a recovery – one that could result in another several month-long surge. In December, the stock set a higher low (a bullish formation) relative to the low from July, and the 50-week moving average managed to stay positive. Last week’s candlestick closed above the last four candle bodies, signaling a bullish shift in momentum.
The stochastic indicator looks good, too, remaining below 80 (suggesting that LEN isn’t overbought) despite last week’s gain. Combined, these factors point to bullish trend continuation from earlier in 2019.
But the “icing on the cake” is last week’s close above LEN’s minor bearish trend (as represented with a yellow trendline). Should LEN close out this week above last week’s high, a breakout will likely have been confirmed. At that point, it might make sense to enter a long position slightly above this current week’s high with a trade trigger of roughly $61.00.
That is, of course, if the current week’s high holds. If LEN is able to set a higher weekly high by Friday, going long above that new high could net an impressive trade.
Even if the general market ends up running out of steam.


