If you’ve been an investor as long as I have, chances are you’ve heard of the infamous “Buffett Indicator”, which according to Warren Buffett himself is “the best single measure of where valuations stand at any given moment.”
And if you look back over this historical data compiled by our analysts, it seems like he might be right:

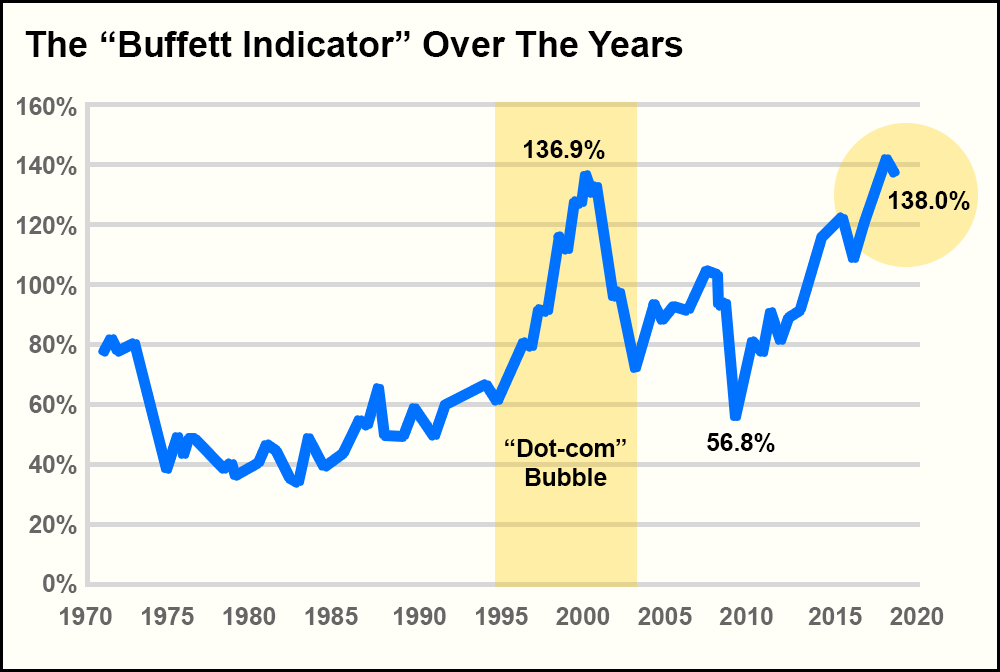
The Buffett Indicator – which is simply the ratio of the total market cap of all U.S. stocks (in this case, the Wilshire 5000 Stock Index) to the overall GDP of the United States – signaled the “dot-com” bubble burst back in 2000, as you can see in the chart above highlighted in yellow.
The higher the Buffett Indicator gets, the greater the chance of a major crash or correction (according to Warren Buffett).
Right before the bubble burst, the Buffett Indicator was registering an all-time high at 136.9%. By comparison, the Buffett Indicator as of yesterday was even higher at 138.0%.
The last time we saw readings anywhere near this level, the market plummeted for the next two years.
So, over the last few days, you may have seen headlines talking about the Buffett Indicator and how it is once again signaling an upcoming crash.
And when you look at the historical data, like presented in the chart above – how can you argue with that logic? The Buffett Indicator shot up, the market shot down – almost like clockwork.
But this year, based on what’s happened so far, it looks like Warren’s favorite market barometer is about to face its biggest test yet. We’re in an extremely unique situation right now, with a market that has arguably been on a bull-run over the last 9 years.
But that’s not what makes our current position special.
What makes things much more interesting, as we near the S&P 500’s all-time high set back in late January of this year, is the fact that companies are buying back stock more than ever before in history.
How much more, you may ask?
This year alone, corporations are on pace to repurchase a staggering $1 trillion worth of stock. That’s an incredible 46% increase from 2017, most likely caused by recent tax reforms and strong performances from some of the market’s biggest players.
If you’d been paying attention to the financial news over the last few months, it’s likely that you’d have noticed the increasing popularity of corporate buybacks. But if you’re anything like me, you wouldn’t have believed just how much companies are starting to claw-back these days.
Many critics of the buybacks argue that they can artificially inflate the value of a stock, priming it for a sudden collapse.
But over the course of the year, almost all of the companies that have re-purchased stock have done so the right way. This has undoubtedly helped in the market’s growth this year and will continue to do so if we stay on track for that $1 trillion mark. By repurchasing stock, companies constrain the amount of shares available – making them more valuable and desirable in the eyes of investors.
In fact, the recent “buyback bonanza” may be what ends up propelling the market forward, regardless of where the Buffett Indicator is at.
We’ve seen great results from buybacks so far, but don’t forget that August, typically the most popular time of the year for buybacks, is just getting started. Many of the large tech companies are still waiting to repurchase stock, and we could see a series of high-profile corporate buybacks that push the S&P 500 to new highs over the next several weeks.
Apple Inc. (NASDAQ: AAPL) hasn’t even started their share repurchasing yet, which will amount to around a total of $100 billion – or roughly 10% of the company’s current value.
So, while old-school investors are happy to throw around the Buffett Indicator (including Warren himself) as a sign of the end-times, just remember that what we’re experiencing right now is like nothing we’ve seen in the past.
A correction may be coming down the road eventually, but it also wouldn’t surprise me at all to see us push the needle on the Buffett Indicator even higher before that happens.


