

Iran, under the direction of Supreme Leader Ali Khamenei, fired missiles at American military bases in Iraq last night. Futures sunk as a result, indicating that the market would get absolutely torched (much like Qasem Soleimani) during trading this morning.
Instead, the market opened slightly higher after Iran’s retaliatory strike missed the mark. In a midday press conference, Trump happily reported that there were no casualties to speak of, and that Iran was likely done lashing out.
Investors, unsurprisingly, were overjoyed by the news. Iran’s failed missile strike – which may have been an intentional “miss” in an attempt to save face – defused today’s market meltdown. Trump’s sobering remarks a few hours later sent stocks soaring.
And with the rising tide, some ships (or stocks, in this case) have distanced themselves from the rest. Not because they’re the day’s “biggest winners,” though.
Some stocks are actually showing signs of weakness in what has been a positive week.

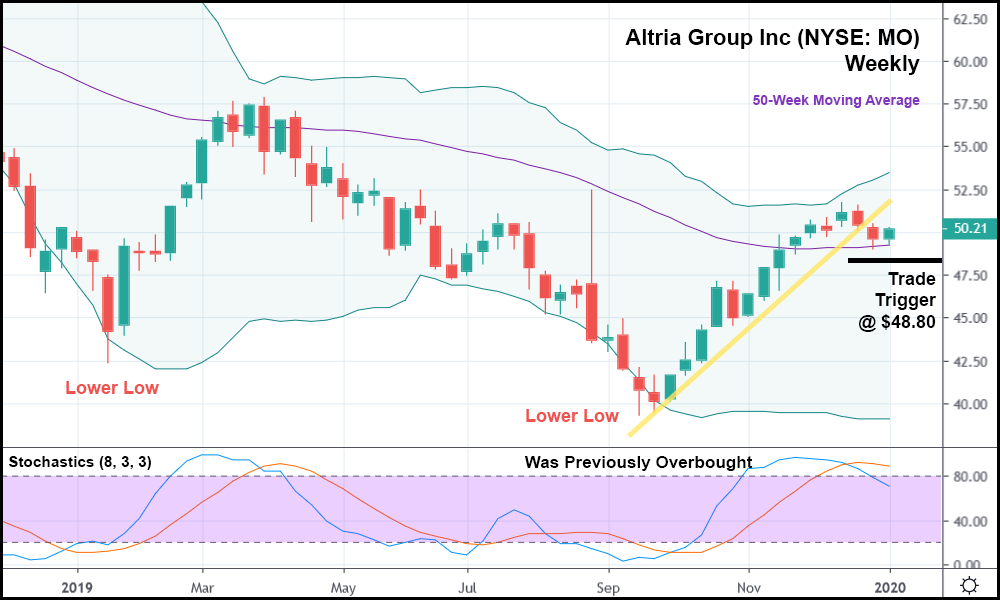
In the weekly candlestick chart above, you can see that Altria Group Inc (NYSE: MO) had a very nice end to 2019. Share prices did little but go up in Q4, providing a reprieve to beleaguered shareholders who have seen steady losses since March.
And now, after topping out in late December, share prices are beginning to recede once again. Yes, MO is up in the current week, but if it can’t close a few green candlesticks in a row from here (and set a higher low), the stock could be ready to collapse once more.
The stochastic indicator suggests that MO was overbought for months, and now, it’s finally starting to drop. Share prices sit dangerously close to the 50-week moving average, too, which is often a level of psychological support.
Should MO trade below last week’s low (and the 50-week moving average) by a significant amount, it might make sense to go short with a trade trigger of $48.80. The presence of two consecutive lower lows in 2019 leads me to believe that MO has more room to fall before truly starting a recovery.
In fact, back in July of last year, you can see that MO failed to recover after going on a three-week winning streak. Because there wasn’t a higher low preceding the soft rally, it eventually fell apart, pulled down by the overwhelming momentum of recent lower lows.
And based on what the chart is giving us, history looks like it could repeat itself. On the daily candlestick chart, MO is somewhat of a choppy stock. It’s hard to discern where the lows truly lie, and what the longer-term moves end up looking like.
But with weekly candlesticks, everything becomes much clearer. It wouldn’t surprise me at all to see bulls get “trapped” by MO’s turnaround this week, only for the stock to fall over the next few months. So, once MO closes out this week, keep an eye on where it goes. If it drops to our trade trigger, there might be a big plunge waiting on the other side.


