

With investors treading water ahead of Fed Chairman Jerome Powell’s address, the market has stagnated – ready to either set new all time highs, or fall in disappointment.
The “nightmare” scenario for bulls involves an interest rate cut in August or September (instead of July). If Powell delays the next rate reduction, the market could easily retrace at least some of early June’s historic gains.
Or, Powell could simply say nothing at all, causing equities to chop sideways until the next major headline.
And while we wait for his afternoon statement on rates, it looks like treasury yields are generating some buzz of their own.
Trade tensions between the U.S. and China, combined with the recent Iran sanctions, have put the 10-year Treasury note in a tough spot. Its yield fell 1.2 basis points this morning to 2.007%, before rising and then falling further. At the time of writing, it sits at 1.988%, slightly below the 2% watermark.

The 2-year note yield, meanwhile, remains somewhat flat on the day despite rising earlier this morning. But what concerned me more than anything else (outside of the 10-year note yield dropping) was that the-1 year Treasury note yield also remains unchanged.
Whenever the gap between the 10-year note yield and the 1-year note yield tightens, it’s typically not good news for bulls.
And when the 10-year yield and 1-year yield cross, it’s time to get worried.
Because the last 7 times that happened, a recession followed.
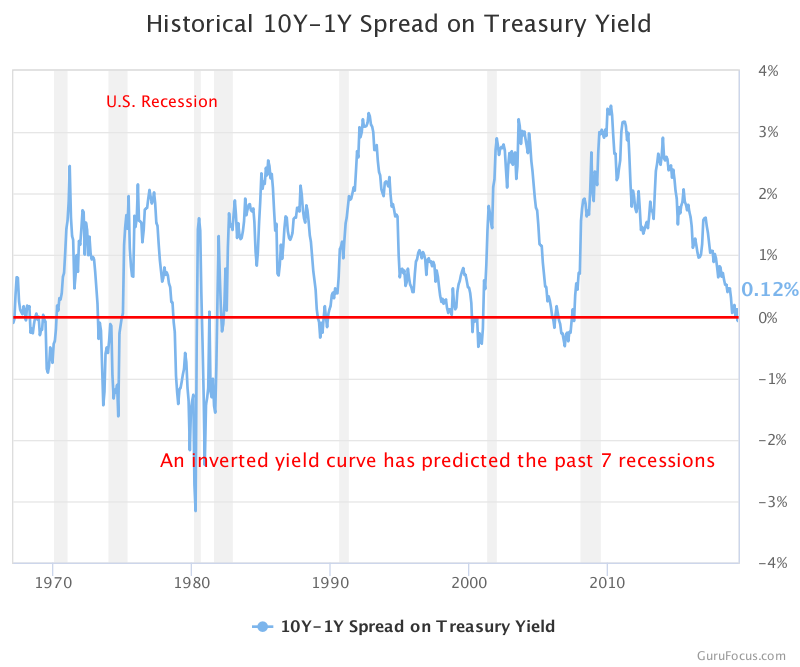
The chart above, which measures the spread between the 10-year Treasury note yield and 1-year Treasure note yield, shows where each recession occurred. Any time the spread dropped below 0% (meaning the yield curve inverted), a recession arrived shortly thereafter.
The last two inversions are perhaps the most famous – one in 2000, another in late 2007.
And based on what the chart is showing us, we’re officially in dangerous territory.
It might be hard to see, but the yields actually did invert recently, before popping back up above the red line.
And today, depending on the content of Powell’s message, we may be in for yet another inversion over the next few days, if not this afternoon.
Analysts love to talk about the 10-year and 2-year yield curve, which has often been seen as an indicator of recession. And that’s absolutely true – an inversion there does typically precede economic strife.
But whenever the 10 and 2 invert, the 10 and 1 do as well – it’s just that the latter happens a little earlier.
So, even though the 10-year and 2-year yield curve hasn’t inverted yet, it looks like it’s only a matter of time before it does.
Investors looking to “cash out” of the market may be able to beat the crowd by instead watching the 10-year and 1-year treasury note yields, pre-empting the 10 and 2-year focused analysts.
If we see another inversion that “sticks” for at least a week or two, bulls could be in for some serious turbulence, regardless of what Trump manages to accomplish in July, short of a trade war truce.
And while a full blown recession may not be in our future, the yield curve could be showing us that at the very least, we need to get realistic about a growth slowdown. 2018’s rip-roaring economy was unsustainable by all accounts, and now that investors are coming back down to earth, there might be a little short-term pain waiting for market optimists.
Even though being a bull has been an absolute joy this last decade, a change in attitude might be prudent for folks looking to protect their portfolios. At least, for the next few months.


